It’s that time of year again, it’s getting warmer out, days are getting longer (assuming you’re in the northern hemisphere), and we get new software to play with. Autodesk has just released a whole bunch of new software, including Civil 3D. Want to know what’s new? Well, just keep reading.
If I know of an issue with one of the new features, I’ll put in a GOTCHA so watch out for those.
For each feature, I’ll also include a Workflow Idea. These will give you an idea on how to leverage the new feature in your workflows. If you have other ideas, let us know in the comments.

Bad News – New File Format
First off, there is some bad news. AutoCAD 2018 introduced a new drawing format which means Civil 3D is not backwards compatible. This honestly comes as a surprise to me, not that they made a new version, but that they kept the prior version for so long. For those of you fairly new to the AutoCAD/Civil 3D world, new drawing versions typically came out every third release or so. The last version of AutoCAD that had a drawing format change was 2013.

Civil 3D 2018 is built on the AutoCAD 2018 file format
Civil 3D on the other hand would have a new object format every single version. We never had any options of backwards compatibility. In 2014, that changed. You could save a Civil 3D 2016 version back to 2013, 2014, or 2015. 2017 saw a new object format which made Civil 3D not backwards compatible and 2018 has both a new drawing format and a new object format so it’s double not backwards compatible.
The reason I bring this up, if one person on the project team decides to upgrade to Civil 3D 2018, the entire project team will need to upgrade. Also, if you install 2018 to test out some of the new features, don’t do it on an active project.
Now let’s get into the good stuff. What’s awesome about the 2018 release?
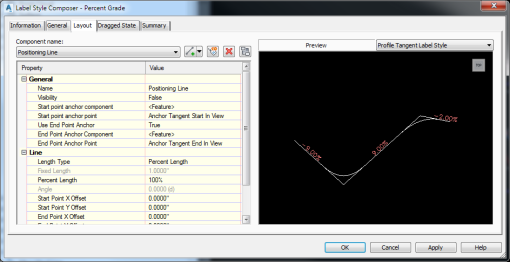
Offset Profiles
We’ve had Offset Alignments for a while now. You know, create an Offset Alignment, adjust the centerline alignment and the Offset Alignments adjust too. You could then create profiles on those Offset Alignments (say for example to have a 2% cross slope) but if you change the offset value, the profile is no longer at 2%. Likewise, if the centerline profile changes, you’ll need to go manually change the profiles to maintain that 2% cross slope. Well, NO MORE! Offset Profiles will do that for you!
When you create the offset alignment, you’ll see an option to also create offset profiles. You simply put in the desired cross slope and when it creates the alignment, the alignment will have a profile that’s dynamic to the parent profile. Change the parent profile, the offset profile changes. If the parent profile has vertical curves, the offset profile will also have vertical curves.
GOTCHA
I’m not exactly sure how the offset profile vertical curves are calculated but they always seem to be there. A possible issue is if you have a vertical curve that is part way in a horizontal curve. If you offset that profile at a 2% cross slope, the resulting profile should not have a parabolic curve. If it does have a parabolic curve, then it’s not a true 2% cross slope. In other words, verify you get the results you want!
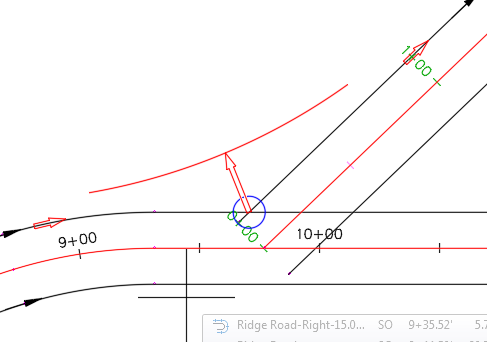
If you want to edit the offset parameters, select the offset alignment and choose, “Offset Profile Parameters” on the ribbon. This will bring up a dialog box that you can go edit those parameters as well as add transitions to the offset profile.
For example, perhaps you need a 2% cross slope for the first 200’ of the alignment and then over the course of 50’ you want to transition to a 4% cross slope and then maintain that to the end. In the Offset Parameters tab of the offset profiles properties, you can simply add in additional cross slope regions.
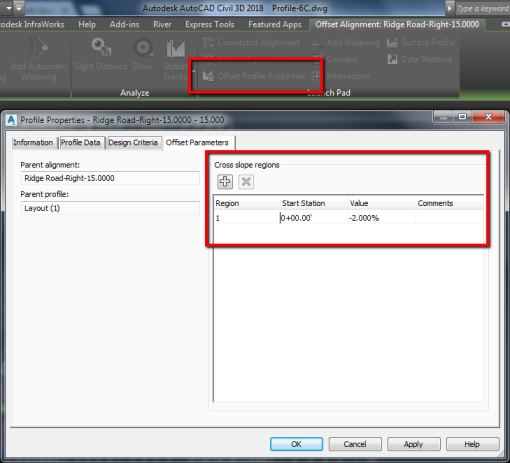
Edit Offset Profiles
GOTCHA
There seems to be an issue with the slope transitions if the parent profile has a PVI within the transition region. Hopefully this will be fixed soon. I would recommend everyone creating a support request for this so we can get it fixed quickly.
Workflow Ideas
So, how can you use this tool to improve your productivity? Just the other day, I had a client ask me how to apply superelevation to an alignment on a trail so he could control the cross slope of the trail (he didn’t want it to slope into the hill as it switched back and forth down the hillside). Using these tools, you can simply create those offset profiles, add in the cross slope regions, and target your lane to the alignment and profile and you’re done. Need to adjust the cross fall for a specific region? Just adjust the cross slope region on the offset profile!
Connected Alignment
Connected alignments are basically an alignment/profile filet. Have two intersecting alignments that you want to put another alignment curved between them yet always tangent to them? Well, this is the tool you want. Simply select the two alignments, pick in the quadrant you want the connected alignment, specify a few values, and you have the connected alignment. One of the options when creating the connected alignment is to create a connected profile as well. The profile will match the elevations of the parent profiles where the two coincide and then transition to match the other profile at the other end.
Choosing the Quadrant for the Connected Alignment

Options When Creating Connected Alignments
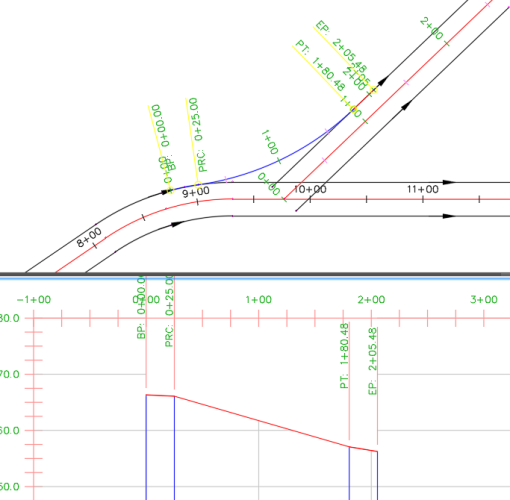
Connected Alignment with Profile
GOTCHA
The two alignments that you want to create a Connected Alignment between must intersect each other. In certain situations, where you might have a non-perpendicular T intersection, the two offset alignments might not intersect each other. In this case, you won’t be able to create a Connected Alignment between them.

Unable to Create Connected Alignments Here
Workflow Ideas
A long long time ago, Autodesk introduced the ability to automate intersection design in Civil 3D however, it only worked well for extremely simple intersections. If things get complex, you’ll need to manually create the intersection. In that case, these tools are ideal!
Extracted Featurelines as Baselines
We’ve been able to extract featurelines from a corridor for quite a while now. Last year, you could also use a featureline as a baseline in a corridor but what you couldn’t do is extract a featureline from a corridor and then add it back into the SAME corridor as a baseline.
In 2018, that limitation has been removed. Extract a featureline and simply add it back into the same corridor as a baseline.
Workflow Ideas
One of the issues I’ve seen with corridor modeling is in the area of lane widening. If I have a lane that widens out and has a sidewalk, if I use one assembly, the width of the sidewalk is calculated relative to the baseline, not the edge of the road. In a case like this, you’ll end up with a sidewalk that isn’t as wide (relative to the edge of road) as it should be. So what do you do? Extract the featureline from the edge of the road and add it back as a baseline to the corridor. To that, attach an assembly that contains the curb, walk, and daylight (or whatever subs you are using) and you’re done!
Corridor Bowtie Cleanup Optional
Introduced into Civil 3D 2017, corridors will now cleanup those nasty bowties for you automatically (in certain instances). Now, in 2018, you can choose whether or not Civil 3D will clean those up for you. On the Settings tab of the Toolspace, right click on Corridor and go into the feature settings. In the feature settings you’ll see new options for the bowtie options. You can choose if you want them to clean up the Tangent-Tangent situations or the Tangent-Arc (and Arc-Tangent) situations independently. Oh, and by the way, IT CLEANS UP TANGENT-ARC INTERSECTIONS NOW!!!!!
Workflow Ideas
I’m not exactly sure why you would want to turn this off but apparently there were people asking for it and so Autodesk included it as an option. I’m all down with options so I’m not going to complain, I just can’t think of a situation where I would want to turn this off. If you can think of one, please leave me a comment.
Daylight Bowties
The bowtie cleanup, as introduced in 2017, was a huge step forward but it wasn’t quite complete. It only worked between two tangents (straight lines) and only worked for links that had a constant width. In other words, the daylighting didn’t clean up. In 2018, they have given you a tool that cleans it up for you. You simply select the alignment piece before the cleanup and the alignment piece after the cleanup and then pick the point you want them to cleanup to. There’s also a tool to remove the cleanup if you want to change it up.

GOTCHA
If the design changes, you’ll have to remove the cleanup and reapply it. The tool will continue to cleanup to the same location even if, after the design change, it’s no longer needed.
Workflow Ideas
I kind of think this one is a no brainer. We’ve all done designs where the inside corners of our corridors didn’t work and we would have to extract featurelines and use the grading tools or manually grade in that area. No more, just use the bowtie cleanup tool and you’re done!
Featureline Elevations Relative to a Surface
Featurelines – I love featurelines. Their ability to adjust with other featurelines is just amazing! New in 2018, you can set featurelines to be dynamic to a surface. If the surface changes, the featureline changes! When you create a featureline from objects or assign elevations to it (either through the command or the Elevation Editor), you can choose a surface as well as the relative elevation that you want them to be relative too. You can also adjust the relative elevation for each individual vertex of the featureline.
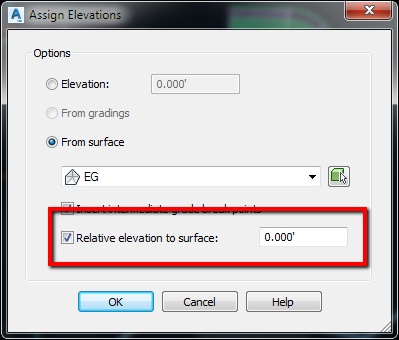
Create Featurelines from Objects

Elevation Editor
GOTCHA
Not a serious gotcha here but, I think you should be aware, a featureline can only reference one surface. If you need a featureline to be relative to two different surfaces, you’ll need to split it into multiple featurelines.
Workflow Ideas
I’m really excited about this one. The area I see it being used really well is for ADA ramps. You know the front of the ram needs to be 6” below the sidewalk and the back of the ramp needs to be at the top of the sidewalk. Create your featurelines that represent the ramp, set the relative elevations, create a surface from it (I’m not sure if I would do one surface per ramp or put them all in the same surface with multiple boundaries, I’ll have to do some testing on it), and then past both the original surface and the ramp surface into a new surface. If the design of the sidewalk changes, the ramp immediately updates too (just double check to make sure it still meets the requirements).
Sections
If you’ve ever worked with sections, you know that what Civil 3D produces is typically not enough for constructions. The sections need additional annotation, blocks, and linework. The problem is, if you move the section views, or if the section views get rearranged automatically, the Autocad objects don’t move with the views, until now. Section Views now have a buffer property. Any AutoCAD objects within the buffer will move with the section view.
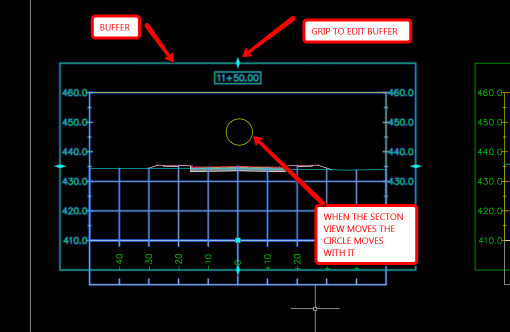
Section View Buffer
GOTCHA
If you adjust the buffer around a section view to include new objects or exclude existing objects, the objects won’t know the buffer has changed until they (the objects) have been edited. Just do a move from 0,0,0 to 0,0,0 and they will re-identify with being inside or outside the buffer.
You can also add new Section Views to a View Group. In the past, if you needed to add a new sample line in between two sample lines, you would have to either manually update the section views to account for the new view or delete them all and recreate them. In 2018, you can simply create the section view and then add it into an existing view group.

Move to Section View Group
Workflow Ideas
For those of you that do roadway design, this one is huge! It doesn’t really create any new workflows, it just greatly simplifies the ones we already have. Need to add a cross section for a new culvert that wasn’t originally planned? Create the sample line, create the view, and add it to the view group. When the layout of the section views updates, any AutoCAD objects in the views will move with the view.
Plan-Plan and Profile-Profile
The plan production tools have been out for ages now and have been pretty much untouched, until now. In 2018 you can now create Plan-Plan sheets and Profile-Profile sheets. The process is pretty much the same, the only difference is in the template that you use to create the sheets. In the template, create the two (or however many you need) viewports and in the properties, set them to the correct type (i.e. plan or profile), and then give them the correct order. The viewports have a new property called “Viewport Order”. The viewport you want to use first will have the Viewport Order=1, the second will have the Viewport Order=2, etc.
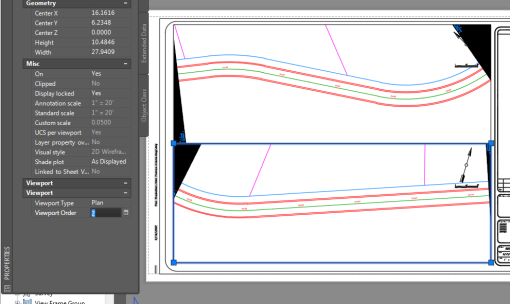
Plan-Plan Production showing the properties of the lower viewport
GOTCHA
The viewports need to have the same dimensions (at least as far as the length of the viewport goes). I tried creating a template with one long viewport and then under that a shorter viewport and it failed. The length of the profile views was calculated using the shorter viewport. I haven’t tested it much but it’s something to be aware of.
Workflow Ideas
I haven’t really come up with any new workflow ideas for this one. Like the section view improvements, it just greatly simplifies the ones we have. In the past, I would create a viewport that was twice as long as I needed and then manually copy it and crop it in order to get the Plan-Plan or Profile-Profile. This just makes the process much easier.
Conclusion
So, what do you think? Which of these are you most excited about? Which one do you think will improve your processes the most? Was there something I missed? I would love to hear your thoughts about the new release. Just leave a comment and let the world know!